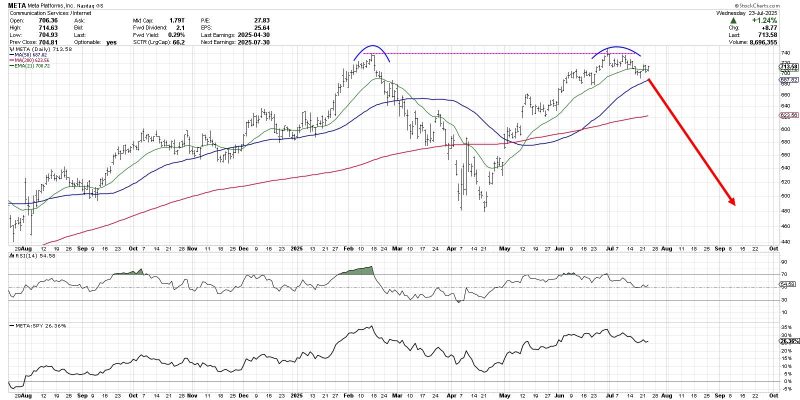
Is META Breaking Out or Breaking Down?
The chart of Meta Platforms, Inc. (META) has completed a roundtrip from the February high around $740 to the April low at
Here are some charts that reflect our areas of focus this week at XLU Leads with New High Even though the Utilities SPDR
The S&P 500 ($SPX) just logged its fifth straight trading box breakout, which means that, of the five trading ranges the index has